
Automating Resource Workload Extraction From MindManager
Discussion Open
Hi everyone,
I am currently using MindManager to plan urban cleanliness operations, and I export resource data to Excel in order to generate a weekly workload timeline.
To automate this process, I am using Power Query to transform the exported MindManager data into a structured, week‑by‑week resource allocation table.
How I use the data
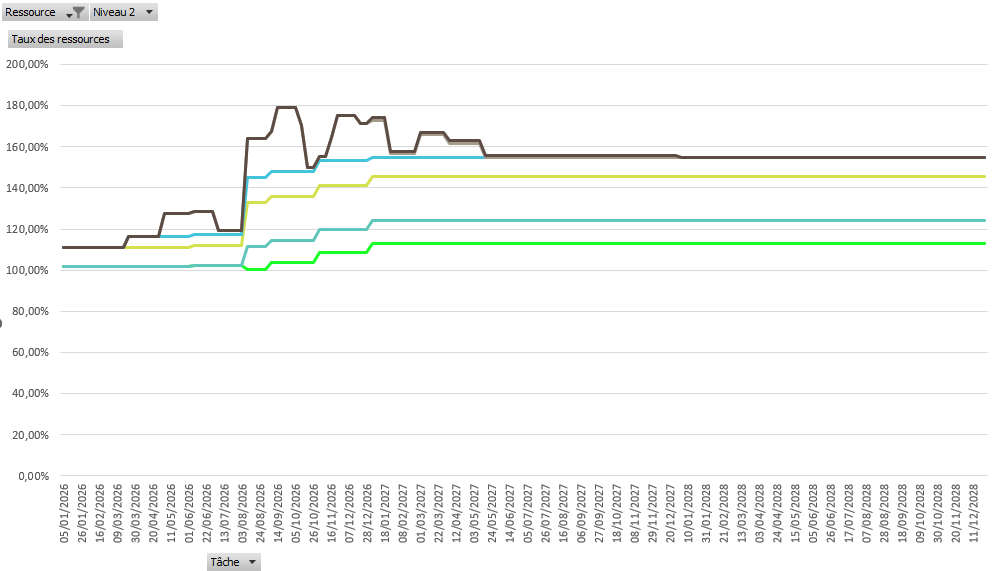
Once transformed, the dataset is used inside an Excel PivotTable and PivotChart, which gives me a weekly overview of each resource’s workload.
I’ve attached an image so you can see what the final output looks like.
My question
Has anyone here had a similar need — automatically generating weekly or periodic resource workload views from MindManager?
- Do you automate this directly inside MindManager (SmartRules, Macros, Topics Properties, etc.)?
- Or do you process the data outside MindManager (Excel, Power Query, Power Automate, BI tools)?
- Do you know better ways to automate this workflow or simplify the resource extraction?
Any experience, advice, or examples would be very helpful!
Here is the Power Query script I'm currently using (The purpose: turn MindManager resource assignments into weekly allocation columns, one column per Monday date.)
let
    // ======================================================
    // 1. IMPORT EXCEL FILE
    // ======================================================
    Source = Excel.Workbook(
        File.Contents("H:\...\EXCEL.xlsx"),
        null,
        true
    ),
    SheetPU = Source{[Item="PROJECT", Kind="Sheet"]}[Data],
    Headers = Table.PromoteHeaders(SheetPU, [PromoteAllScalars=true]),

    // ======================================================
    // 2. COLUMN TYPES
    // ======================================================
    Types = Table.TransformColumnTypes(
        Headers,
        {
            {"Niveau 0", type text},
            {"Niveau 1", type text},
            {"Niveau 2", type text},
            {"Niveau 3", type text},
            {"Niveau 4", type text},
            {"Niveau 5", type text},
            {"Niveau 6", type text},
            {"Icônes: En place", type text},
            {"Balises: Temps", type text},

            {"Nom de la ressource n°1", type text},
            {"Chargement de la ressource n°1", Percentage.Type},
            {"Nom de la ressource n°2", type text},
            {"Chargement de la ressource n°2", Percentage.Type},
            {"Nom de la ressource n°3", type text},
            {"Chargement de la ressource n°3", Percentage.Type},

            {"Date de début", type date},
            {"Date de fin", type date},
            {"Durée (Jours ouvrés)", Int64.Type},
            {"Effort (Jours ouvrés)", type number}
        }
    ),

    // ======================================================
    // 3. REMOVE UNUSED COLUMNS
    // ======================================================
    Cleaned = Table.RemoveColumns(
        Types,
        {
            "Propriété: ",
            "Propriété: %"
        }
    ),

    // ======================================================
    // 4. DETECT RESOURCE COLUMNS
    // ======================================================
    ColRes = List.Select(Table.ColumnNames(Cleaned), each Text.StartsWith(_, "Nom de la ressource")),
    ColLoad = List.Select(Table.ColumnNames(Cleaned), each Text.StartsWith(_, "Chargement de la ressource")),

    // ======================================================
    // 5. UNPIVOT RESOURCE COLUMNS
    // ======================================================
    Unpivot = Table.Unpivot(Cleaned, ColRes & ColLoad, "Attribute", "Value"),

    // ======================================================
    // 6. SPLIT TYPE (Name/Load) AND NUMBER
    // ======================================================
    Split = Table.SplitColumn(
        Unpivot,
        "Attribute",
        Splitter.SplitTextByEachDelimiter({" n°"}, QuoteStyle.Csv, false),
        {"Type", "Number"}
    ),

    // ======================================================
    // 7. PIVOT BACK INTO TWO COLUMNS
    // ======================================================
    Pivot = Table.Pivot(
        Split,
        List.Distinct(Split[Type]),
        "Type",
        "Value"
    ),

    // ======================================================
    // 8. RENAME COLUMNS
    // ======================================================
    Renamed = Table.RenameColumns(
        Pivot,
        {
            {"Nom de la ressource", "Resource"},
            {"Chargement de la ressource", "Load"}
        },
        MissingField.Ignore
    ),

    // ======================================================
    // 9. REMOVE ROWS WITHOUT RESOURCE
    // ======================================================
    Filtered = Table.SelectRows(Renamed, each [Resource] <> null),

    // ======================================================
    // 10. TYPE FIXING
    // ======================================================
    LoadTyped = Table.TransformColumnTypes(Filtered, {{"Load", Percentage.Type}}),

    // ======================================================
    // 11. REMOVE NUMBER COLUMN
    // ======================================================
    NoNumber = Table.RemoveColumns(LoadTyped, {"Numero"}),

    // ======================================================
    // 12. WEEKLY DATE LIST
    // ======================================================
    StartPlanning = #date(2026, 1, 5),
    EndLimit = #date(2028, 12, 31),

    DateList =
        List.Generate(
            () => StartPlanning,
            each _ <= EndLimit,
            each Date.AddDays(_, 7)
        ),

    // ======================================================
    // 13. CREATE WEEKLY COLUMNS
    // ======================================================
    AddCols =
        List.Accumulate(
            DateList,
            NoNumber,
            (state, d) =>
                Table.AddColumn(
                    state,
                    Date.ToText(d, "dd/MM/yyyy"),
                    each
                        if [Resource] = null or [Resource] = "" then null
                        else if [Date de début] <= d and [Date de fin] >= d then
                            if [Load] = 0 then null else [Load]
                        else null,
                    Percentage.Type
                )
        ),

    // ======================================================
    // 14. UNPIVOT FINAL STRUCTURE
    // ======================================================
    UnpivotFinal =
        Table.UnpivotOtherColumns(
            AddCols,
            {
                "Niveau 0", "Niveau 1", "Niveau 2", "Niveau 3",
                "Niveau 4", "Niveau 5", "Niveau 6",
                "Icônes: En place", "Balises: Temps",
                "Date de début", "Date de fin",
                "Durée (Jours ouvrés)", "Effort (Jours ouvrés)",
                "Resource", "Load"
            },
            "Week Start Date",
            "Weekly Load"
        ),

    // ======================================================
    // 15. FINAL COLUMN TYPES
    // ======================================================
    Final =
        Table.TransformColumnTypes(
            UnpivotFinal,
            {{"Week Start Date", type date}}
        )
in
    Final
Thanks in advance for your insights!
I’m sure several users have similar needs, and it could help many of us improve MindManager resource planning workflows.
Files:
TCD_PROJECT.png
Hi Augustin,
is the Resources view in the Gantt chart not sufficient, or do you need different or additional information regarding resource utilisation?
Hi Augustin,
is the Resources view in the Gantt chart not sufficient, or do you need different or additional information regarding resource utilisation?
---