
Gannt Chart task order
Answered
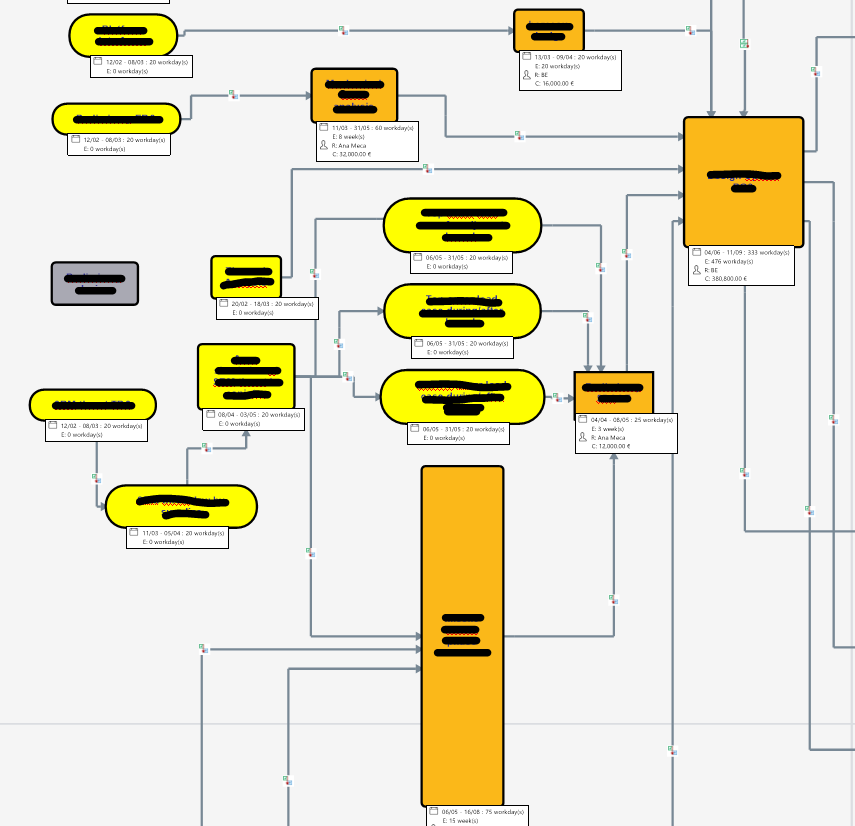
I have created a large map to plan activities over time with dependency logic between tasks. I have then added resources and durations to each activity.
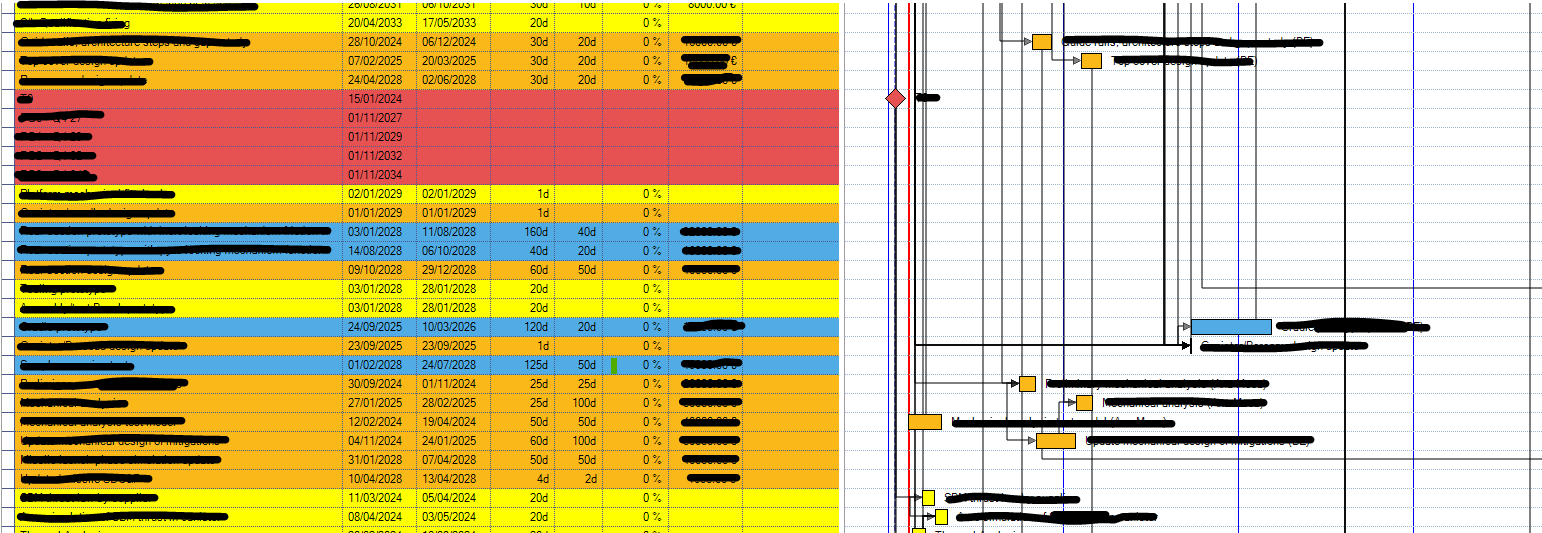
I then turned this into a Gantt chart using the "show Gantt pro" feature. I would like to change the order of tasks in the left column to how I would like to better visualise the workstreams. Can this be done? You can see in my Gantt chart the dependences go up and down the chart as the activities are not in a good order.
From what I can see, I can only "sort chart by start date" or "sort chart by map order", neither of which allow you to see the dependences and work streams easily. Is there a manual way to order them?
Good morning,
I am not aware of any other sorting option.
If you mark these with a tag, you can filter them. The filtered ones are then displayed in the Gantt.
Are there sub-processes in your visualisation?
If you mark these sub-processes with a tag, you can then filter them. The filtered ones are then displayed in the Gantt.
When it comes to project tasks, I prefer to set up a phase-orientated WBS. This means that the dependencies are only ever in one phase.
René
The "map order" used by the Gantt chart relates to the tree structure, as the Gantt feature is primarily designed to work with WBS trees. WBS allows you to create summaries and roll-ups, and the basic goal of a Gantt chart is to show a project in date sequence from beginning to end. The order in which floating topics are returned by MindManager is indeterminate; this affects other tree-oriented exports such as the Word export, not only the Gantt chart. If a network of tasks represents your project better than a tree, then you could make the Gantt chart more readable by using filtering. You could mark groups or sequences of tasks with icons, colours, or tags, then filter the map by these markers, so that the Gantt chart shows only a filtered workstream.
The "map order" used by the Gantt chart relates to the tree structure, as the Gantt feature is primarily designed to work with WBS trees. WBS allows you to create summaries and roll-ups, and the basic goal of a Gantt chart is to show a project in date sequence from beginning to end. The order in which floating topics are returned by MindManager is indeterminate; this affects other tree-oriented exports such as the Word export, not only the Gantt chart. If a network of tasks represents your project better than a tree, then you could make the Gantt chart more readable by using filtering. You could mark groups or sequences of tasks with icons, colours, or tags, then filter the map by these markers, so that the Gantt chart shows only a filtered workstream.
Hi Mitchell,
I'm afraid those are the only two options.
In your case to complicate matters it appears you have either started with a free-form map template and/or have used floating topics which are linked only by relationship lines, which means that it is very difficult for the Gantt chart to "read" the map order.
If you start with a more traditional map template with a central topic then it is easier to move main topics and their branches around in the map view to change the Gantt chart order.
Edit: Apologies - I started this reply and then left it for a while. It was only when I posted that I realised that in the interim Rene and Nick had explained the situation far more eloquently than me and also suggested some solutions.
Thank you for the responses. It is a shame I cannot simply move the order of the tasks in the Gantt chart manually and have the best of both worlds (a network of tasks and an easily readable Gantt chart). I will try both of the methods you have mentioned and see which gives the best results.
Thank you for the responses. It is a shame I cannot simply move the order of the tasks in the Gantt chart manually and have the best of both worlds (a network of tasks and an easily readable Gantt chart). I will try both of the methods you have mentioned and see which gives the best results.
---