
the next step to higher productivity
For more than 20 years Mindmanager has been my productivity booster. It helps to orden my thoughts, to play on different fields, to plan and to produce. Now I feel it is time for a next round.
Spending time with mindmanager as part of a creative process, planning or writing is OK. But spending time to visualize my information is becoming more and more a load. That should change.
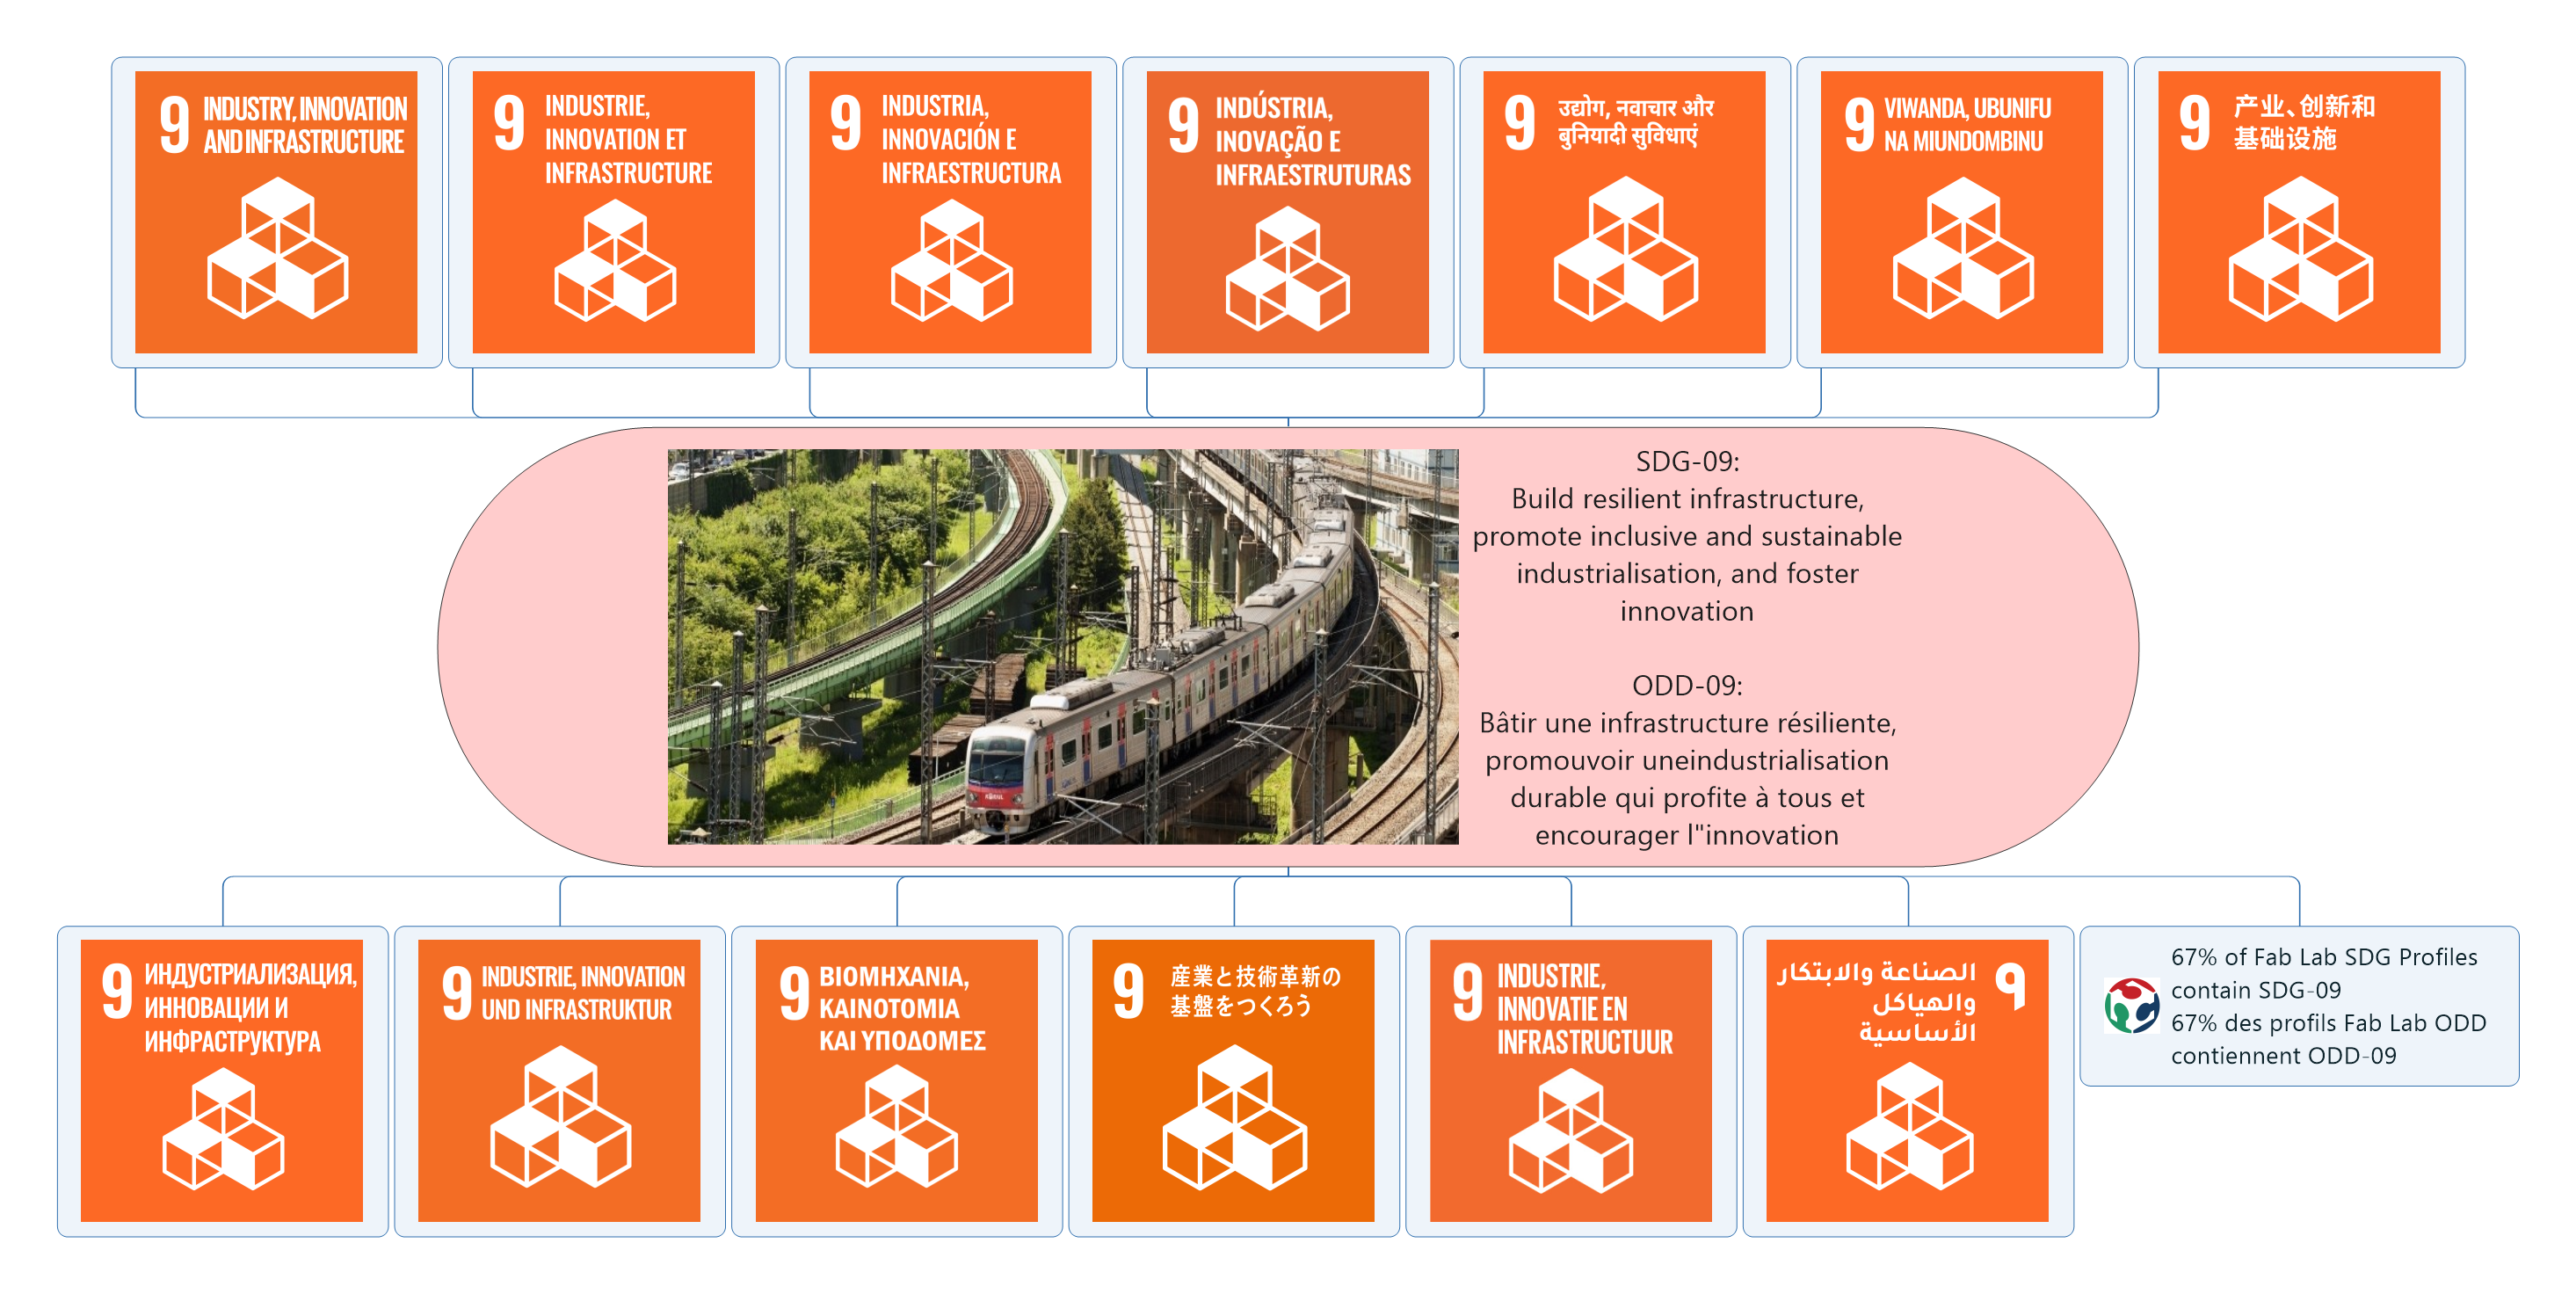
BTW look at the attached mindmap. Very simple in structure. But be honest, how many minutes will it take to produce such a map? And this map is about UN Sustainable Development Goal #09. There are 17 such goals, so producing 17 maps will cost you 17 times that amount of time.
All this time you can not spend to creative mindmapping!
My question / proposal: we have to distinguish creative work from creating graphics. The latter should become more and more data driven. There exist some connections between data and mindmanager (databases, Excel mapping). These are nice if they exactly fit your need. I am afraid that my simple example map does not fit. So there is a Missing Link.
What do you think about it?
One of the great strengths of mind mapping software and in particular MindManager is its versatility. The software has grown from fairly simple beginnings as a simple tool for brainstorming and presenting hierarchically-organised information to something with a thousand different uses. MindManager for example has been described as a "Swiss army knife", a tool which can be used for just about anything.
The trade-off for this versatility is that any mind mapping program is not necessarily the best option if you really want to specialise in each of these application areas. MindManager for example is great for managing projects, but it obviously isn't as dedicated to this task as say Microsoft Project. On the other hand, Project can't do any of the other things that MM can do.
Also each mind mapping application strikes a different balance in terms of the included features. MindManager for example is better at project management and analytics than just about any of its competitors, but perhaps isn't as strong in terms of presentation options as some other applications. This is improving, but I think that MindManager/Corel still have a bit more work to do here; I'm surprised for example that there hasn't been any integration with CorelDRAW.
The upshot is that you may be better off completing the maps directly in a dedicated graphics application. If you can find one that will import from Word you could always start work on the maps in MM then export the outlines to Word. Having said that there is a lot you can do within MM, especially through tools such as SmartRules which can used to partially automate aspects of formatting.
Afternoon Pieter
To me it reads like your asking why can't you execute the entire creative process from conceiving to presenting within MindManager. If I'm wrong then pay me no more heed.
I've been spending quite a lot of time thinking about productivity of late. In taking ideas from initial thought to implementation, I use MindManager in the classic GTD way: Capture, Clarify, and Organise. GTD is a very good methodology for those 3 things. However, when I have to manage a large set of tasks, I find it less good for the final part of that method (Do). It took me longer than it ought to accept that. Now, for me "Do" is all about task management - and I have a good process that works for me outside of GTD.
MindManager is the right tool for some things but not all. If you find you're spending too much time trying to force MindManager to work in a particular way perhaps it's not meant to be, at least, not yet. Is there a better tool or person with a skill that can achieve what you want?
It is fine to request the MM team to enhance the product but the subject of data visualisation covers all manner of use cases, so you might need to be more precise.
Regards
James.
---